
What IDR 10,000 Can Buy in AI Coding: A 32M Token Experiment
What can IDR 10,000 buy today?
Perhaps a few snacks, a cup of coffee, or, apparently, access to hundreds of millions of AI tokens for coding experiments.
This article is a snapshot of a small experiment I ran to find out how far that budget actually goes.
1. A Small Budget, a Surprisingly Large AI Sandbox
I recently added an IDR 10,000 balance to NaraRouter and selected Qwen 3.8 27B as the primary model in its cost calculator. The usage composition shown was Cache read 90%, Input 9%, Output 1%, at an estimated price of Rp 25 per 1M tokens. Based on that composition, the platform estimated that the balance could cover approximately 392.3 million tokens.
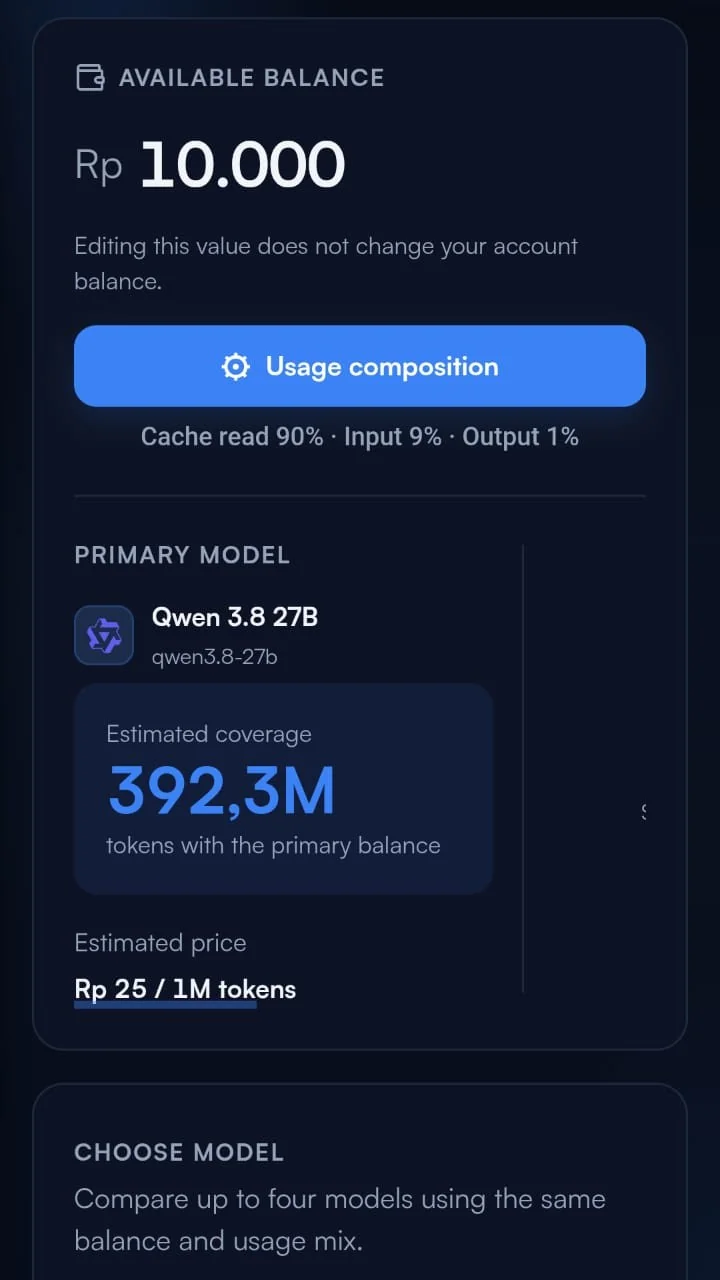
That number immediately caught my attention.
Rather than treating the estimate as a guaranteed outcome, I decided to test the platform using an actual coding workload and observe how the numbers developed over 24 hours.
The result was an interesting example of how model pricing, caching, routing, and workload characteristics can work together to shape the real economics of AI-assisted development.
2. The Results After 24 Hours
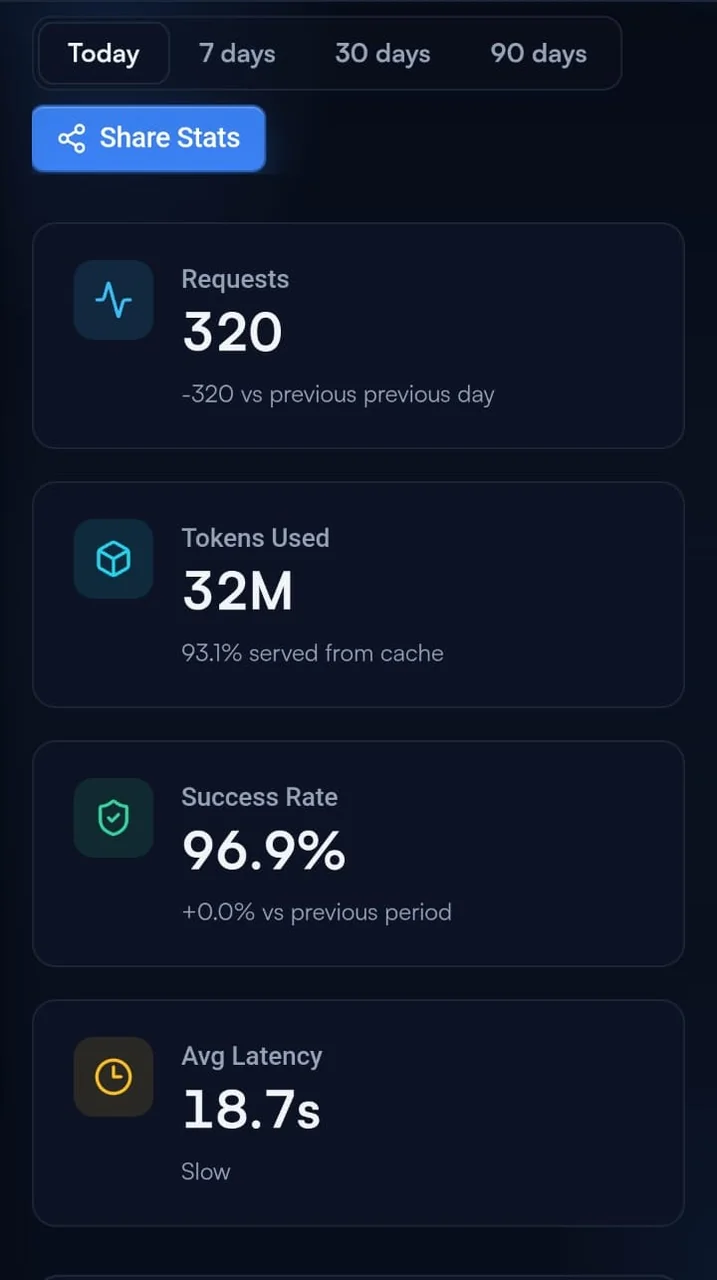
During the first 24 hours, the dashboard reported:
- 320 requests
- 32 million routed tokens
- 96.9% success rate
- 93.1% of usage served from cache
- 18.7-second average latency
- IDR 1,260 estimated pay-as-you-go cost, approximately USD 0.07 on the displayed calculation
The first distinction worth making is between the estimated token coverage and actual usage.
The 392.3 million tokens represented an estimate based on the selected model and usage composition. It was not the number of tokens already consumed. The actual measured workload for the first 24 hours was 32 million routed tokens.
Even with that distinction, processing 32 million tokens at an estimated cost of IDR 1,260 was still a notable result.
3. The Importance of Cache Utilization
The most interesting metric was not the total token count. It was the cache utilization rate.
According to the dashboard, 93.1% of the token usage was served from cache.
This helps explain why a large routed-token count did not translate directly into an equally large cost.
From my perspective as a Senior System Analyst and Senior Programmer, this is an important reminder that evaluating AI infrastructure based only on the published price per million tokens may provide an incomplete picture.
The surrounding architecture can be just as influential.
Several factors can affect the final cost of an AI workload:
- How frequently context is reused
- How much of the workload qualifies for cached-token pricing
- How prompts and system instructions are structured
- How long the context sent in each request is
- How often prompts or contexts repeat
- Which models handle different types of requests
- Whether every task truly requires the most capable model
- How much latency the workflow can tolerate
A lower model price is useful, but efficient workload design can potentially create an even larger difference.
4. Using Multiple Models Through Routing
The workload was distributed across several models rather than being handled exclusively by one model.
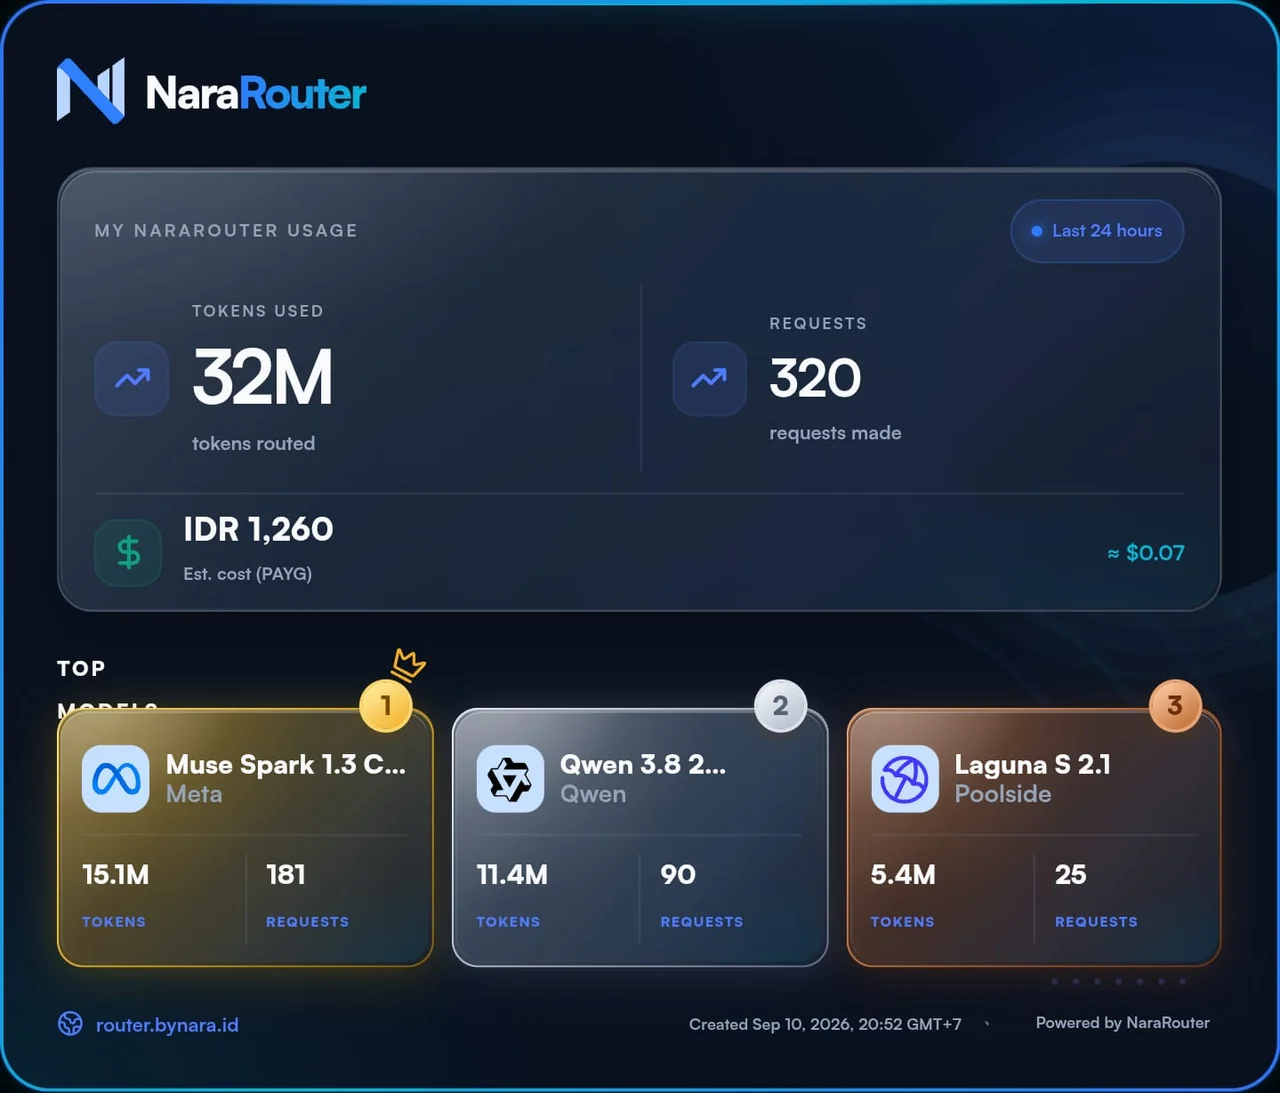
The top three models shown in the usage summary were:
- Muse Spark 1.3, with 15.1 million tokens across 181 requests
- Qwen 3.8, with 11.4 million tokens across 90 requests
- Laguna S 2.1, with 5.4 million tokens across 25 requests
This distribution made the routing approach particularly interesting to me.
In software development, not every task requires the same level of reasoning, context, speed, or model capability. A complex architectural review and a simple formatting task should not necessarily be sent to the same model.
A routing layer can provide room to match different workloads with different models. The practical value, however, depends on several things:
- The router’s decision quality
- The availability of each model
- Output format and quality consistency
- Response speed
- Request failure rate
- Long-context handling capability
- Fit with the programming language and task type
I am still evaluating those aspects, so I would treat this as an early observation rather than a final conclusion.
5. The Main Trade-Off: Latency
The setup was inexpensive, but it was not without compromise.
The average latency during this experiment was 18.7 seconds, which the dashboard categorized as slow.
That response time would probably be difficult to accept in a real-time, customer-facing application. Users generally expect interactive systems to respond much faster, especially in conversational interfaces.
For other workloads, the same latency may be acceptable.
Examples include:
- Coding agents running multi-step tasks
- Background code analysis
- Automated code reviews
- Documentation generation
- Code refactoring
- Prototype experiments
- Internal automation
- Unit test generation
- Migration or code transformation
- Asynchronous research and processing
For these use cases, a developer may not need to wait and watch the response directly. The agent can run the task in the background while the developer works on something else.
The relevant question is not simply whether 18.7 seconds is fast or slow. The more useful question is whether that latency is appropriate for the specific workload and user experience.
6. Cost per Request Needs Context
If 32 million tokens are divided by 320 requests, the average reaches roughly 100 thousand tokens per request.
That average needs to be read carefully.
Not every request uses the same number of tokens. Some requests may carry very large contexts while others are far smaller. The mix of input tokens, cached tokens, and output tokens also affects the final cost.
For a more accurate cost evaluation, I want to track additional metrics in the next experiment:
- Non-cached input tokens
- Cached input tokens
- Output tokens
- Cost per model
- Average cost per request
- Latency per model
- Failed request percentage
- Retries
- Output quality per task category
For me, low cost does not automatically mean efficient.
If a model’s output needs too much correction, produces unusable code, or forces the agent to redo work repeatedly, the effective cost can end up higher.
Conversely, a slightly more expensive model can be more economical if it finishes the job in fewer requests with better output quality.
7. A Practical Vibe Coding Setup Does Not Need to Be Expensive
This experiment also made me think about the physical side of a practical coding setup.
Beyond token costs, a small accessory like a wireless mouse can add flexibility when moving between a laptop, tablet, or other work devices.
One affordable option I found is the Goojodoq Dual Mode Wireless Bluetooth Mouse, which supports both Bluetooth and 2.4 GHz connectivity. The displayed price was approximately IDR 44,823 when I checked it. Product availability and pricing may change following store policies or ongoing promotions.
You can view the product here:
Check the Goojodoq Dual Mode Wireless Bluetooth Mouse on Shopee
Affiliate disclosure: The Shopee URL above is an affiliate link. I may receive a commission if a qualifying purchase is made through the link, without additional cost to the buyer.
It is not essential to the AI experiment, of course, but it fits the same general idea: building a functional coding environment while keeping the initial cost reasonable.
8. What I Learned From the Experiment
My main takeaway is that AI development costs should be evaluated at the system level.
Token pricing is only one part of the calculation. Other components worth watching include:
- Model routing strategy
- Cache utilization
- Context management
- Prompt structure
- Model selection
- Service reliability
- Latency
- Retry counts
- Output quality
- Time spent on corrections
The first 24 hours showed a promising cost-to-experiment-capacity ratio for my particular workload. At the same time, the 18.7-second latency makes it clear that the setup will not be suitable for every application.
Results may also vary depending on model choice, token composition, prompt patterns, cache behavior, and the type of coding activity being performed.
For me, that is where the main value of this experiment lies.
The goal is not to prove that one platform, model, or configuration is the best choice for everyone. This experiment provides early data for deciding which workloads fit and which ones need a different approach.
9. Can IDR 10,000 Really Produce 392.3 Million Tokens?
The short answer is: that number is an estimate, not a guaranteed outcome for every usage pattern.
The 392.3-million-token estimate was based on a specific model and usage composition. If usage produces more output tokens, has a low cache hit rate, uses more expensive models, or sends fresh context on every request, the balance coverage will likely differ.
In my experiment, cache usage reached 93.1%. That condition had a major influence on the low cost estimate.
So the hundreds-of-millions figure should not be read as a fixed quota every user receives. It is better understood as a projection under specific usage assumptions.
10. Try It With Your Own Workload
If you would like to test NaraRouter and compare the results using your own prompts, models, coding agents, and workload patterns, you can register through the following link:
Referral disclosure: The registration URL above is my referral link. I may receive a referral benefit if you register or use the platform through the link.
I plan to continue this experiment with more specific scenarios, such as a coding agent building a feature, repository refactoring, unit test generation, debugging, and long-context codebase analysis.
If you had access to hundreds of millions of tokens on a small budget, what would you build first?
Related Articles
- Apa yang Bisa Didapatkan dari Rp10.000 untuk AI Coding? Eksperimen 32 Juta Token (Indonesian version)
Comments